In our first blog post we covered the need to track, aggregate, enrich and visualize logged data as well as several software solutions that are made primarily for this purpose. In conclusion, we explained briefly why we chose ELK stack.
Here we’ll dive a little bit deeper and get more technical. So, a quick plan on what’s coming next:
- a log shipper (What is Filebeat),
- a swiss-army knife for logs (What is Logstash),
- a life of Nginx access log when it gets hijacked by a log shipper and is cleaned from the dirt, given a new haircut, clean shave, new ID card and passport by a swiss-army knife.
Here’s how will we do it step by step so it’s easier to track just where this post will go, as there’s really a lot to share with you:
- Introduction to Filebeat,
- Introduction to Logstash,
- Go over Nginx logs and their formatting options,
- Grok patterns,
- Setting up Filebeat,
- Setting up Logstash,
- Enriching log data.
Since we’ll cover basic information regarding each part of the technology used and several configuration options, this blog has been divided into two parts. In this part we’ll focus more on theoretical aspect, followed by some grok patterns and we’ll finish with Logstash configuration. In second part we’ll cover Logstash configuration in detail, enrich the data in a fun way and show what should Logstash write to output.
Practical demonstration was run on an Ubuntu 14.04 virtual machine run by VirtualBox and Vagrant. The locations of configuration files in this post apply for Ubuntu/Debian based systems and may vary for other systems and distributions.
Let’s begin with a brief introduction into specific choices of the Elastic stack.
Filebeat – a log shipper
Filebeat is a part of beats family by Elastic. Beats are essentially data shippers. They send chosen data (i.e. logs, metrics, network data, uptime/availabitily monitoring) to a service for further processing or directly into Elasticsearch. Our goal for this post is to work with Nginx access log, so we need Filebeat. When pointed to a log file, Filebeat will read the log lines and forward them to Logstash for further processing. The ‘beat’ part makes sure that every new line in log file will be sent to Logstash.
Filebeat sits next to the service it’s monitoring, which means you need Filebeat on the same server where Nginx is running. Now for the Filebeat configuration: it’s located in /etc/filebeat/filebeat.yml, written in YAML and is actually straightforward. The configuration file consists of four distinct sections: prospectors, general, output and logging. Under prospectors you have two fields to enter: input_type and paths. Input type can be either log or stdin, and paths are all paths to log files you wish to forward under the same logical group.
Filebeat supports several modules, one of which is Nginx module. This module can parse Nginx access and error logs and ships with a sample dashboard for Kibana (which is a metric visualisation, dashboard and Elasticsearch querying tool). Since we’re on a mission to educate our fellow readers, we’ll leave out this feature in this post.
Logstash - swiss-army knife (in this case - for logs)
Logstash can be imagined as a processing plant. Or a swiss-army knife. It resembles a virtual space where one can recognize, categorize, restructure, enrich, thus enhance, organize, pack and ship the data again.
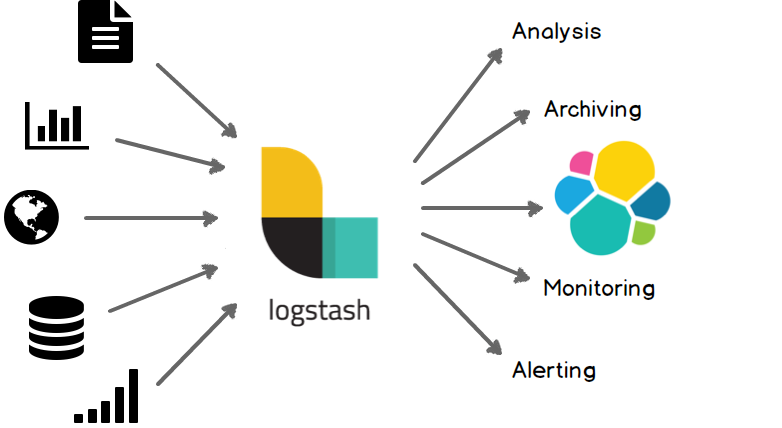
Source: Logstash official docs
The inside workings of the Logstash reveal a pipeline consisting of three interconnected parts: input, filter and output.
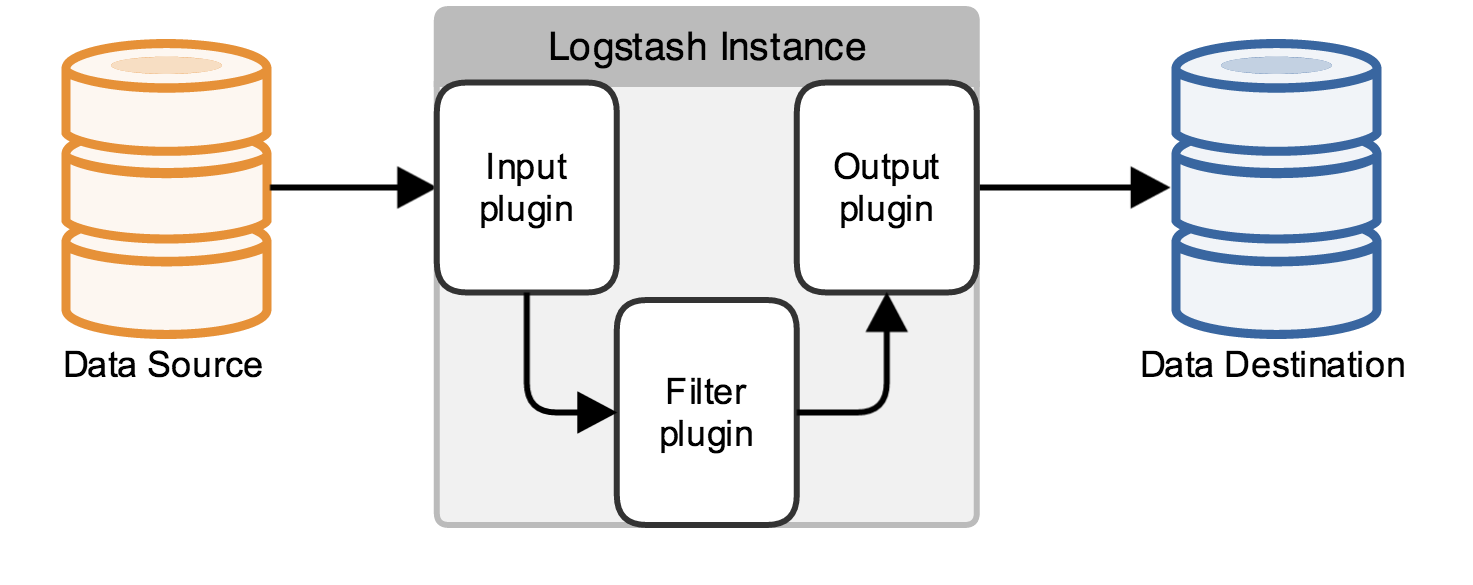
Source: Logstash official docs
If you’re using Ubuntu Linux and have installed through package manager (apt), the configuration file(s) for logstash by default reside in /etc/logstash/conf.d/ directory. The configuration file can be either:
- one file consisting of three distinct parts (input, filter and output),
- smaller configuration files and certain rules then apply about how Logstash combines these into a complete configuration (
input.conf+filter.conf+output.conf), but we won’t delve into that yet because it leaves the scope of this post.
To achieve the feature of modular configuration, files are usually named with numerical prefix, for example:
- 10-input.conf
- 20-filter.conf
- 30-output.conf
Upon starting as a service, Logstash will check the /etc/logstash/conf.d/ location for configuration files and will concatenate all of them by following ascending numerical order found in their names.
GROK
Grok is a filter plugin that parses unformatted and flat log data and transforms them into queryable fields and you will most certainly use is for parsing various data.
The definition of word grok is “to understand (something) intuitively or by empathy.” Essentially, grok does exactly that in terms of text – it uses regular expressions to parse text and assign an identifier to them by using the following format: %{REGEX:IDENTIFIER}. The list of grok patterns for Logstash can be found here. There are of course some special characters that can exist in raw data that clash with grok; they must be escaped with a backslash.
There is a helpful tool online for debugging and testing your grok pattern.
Logstash has a set of predefined patterns for parsing common applications log formats, such as Apache, MySQL, PostgreSQL, HAProxy, system logs and much more. Users are free to write their own grok patterns if they like.
In this case we’ll work with Nginx log data, configure Filebeat to send this data to Logstash, for which we’ll spend most of the time configuring.
Log Data - Nginx log
Web server logs store valuable usage data - visitor IP address, user agent activity, urls of site visited, HTTP methods used, bytes transferred, various performance parameters (i.e. the time it takes web server to serve some requested content), to name a few.
The flat log file with this valuable data is extremely difficult to read by most humans. Let’s say that a business wants to know where are their most loyal visitors located on the globe and they’ve assigned you with this task. How would you approach this challenge? Or for example, your support department is handling a surge of clients reporting frustratingly slow response time of your web service. How do you filter out which servers are out of the norm by their response time?
Lastly, you may ask yourself: “what does my Nginx log file look like?” If your Nginx configuration is default, then the log format is defined in your /etc/nginx/nginx.conf file as:
log_format combined '$remote_addr - $remote_user [$time_local] '
                    '"$request" $status $body_bytes_sent '
                    '"$http_referer" "$http_user_agent"';
Source: Nginx official docs
Let’s open the access.log file and check it out. Generated log data with default configuration looks like this:
192.168.1.14 - - [10/Nov/2017:15:17:20 +0000] "GET /favicon.ico HTTP/1.1" 200 199 "http://192.168.1.19/" "Mozilla/5.0 (Macintosh; Intel Mac OS X 10_12_6) AppleWebKit/537.36 (KHTML, like Gecko) Chrome/61.0.3163.100 Safari/537.36"
It may be a good idea to check how is the log format defined in the nginx.conf file before checking the log lines. We’ll use this log line for writing and debugging our grok pattern.
GROK pattern primer
Let’s play: with this one line of Nginx log file, let’s try out some patterns.
Extract only IP address and timestamp
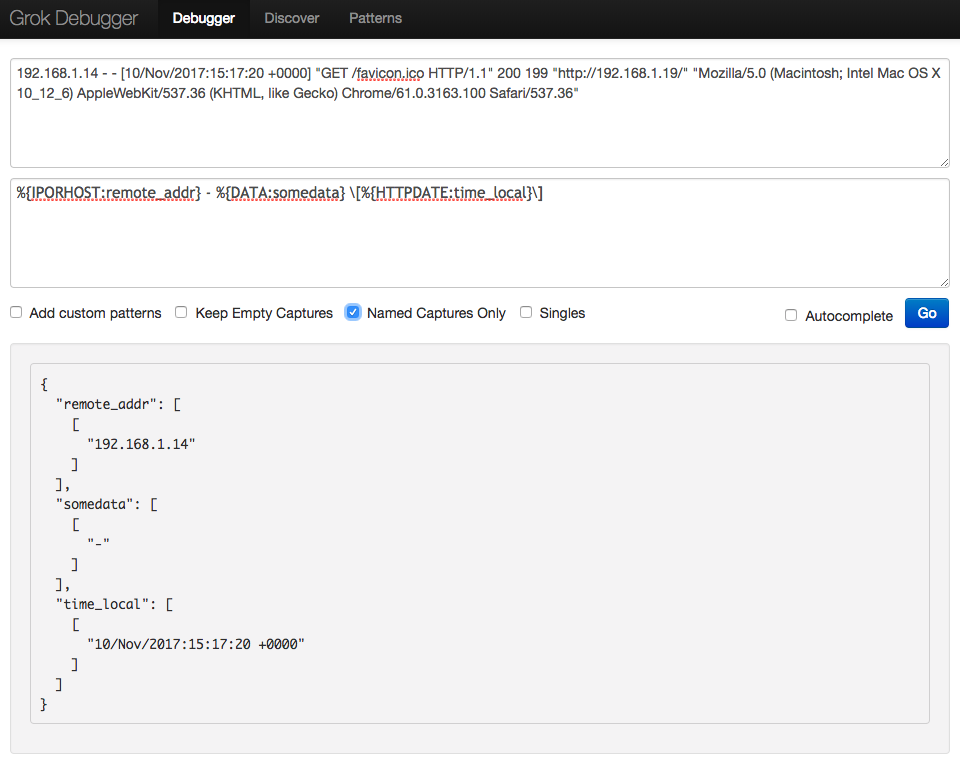
The pattern is:
%{IPORHOST:remote_addr} - %{DATA:somedata} \[%{HTTPDATE:time_local}\]
Since we’re currently not interested in knowing information about remote user, we will capture this ‘field’ and assign it with identifier somedata, but we will disregard the captured content.
Also note we had to escape square brackets. Likewise, quotation marks have to be escaped as well (if there are quotation marks in your log file). The end result is this:
{
  "remote_addr": [
    [
      "192.168.1.14"
    ]
  ],
  "somedata": [
    [
      "-"
    ]
  ],
  "time_local": [
    [
      "10/Nov/2017:15:17:20 +0000"
    ]
  ]
}
What about other logs?
Let’s try parsing one line from /var/log/auth.log file in a similar fashion:
The log line is:
Dec 12 12:32:58 localhost sshd[4161]: Disconnected from 10.10.0.13 port 55769
And the pattern is:
%{MONTH:[auth][timestamp][month]} %{MONTHDAY:[auth][timestamp][day]} %{TIME:[auth][timestamp][time]} %{IPORHOST:[auth][hostname]} sshd(?:\[%{POSINT:[auth][pid]}\])?: %{DATA:[auth][event]}
The debugger has parsed the data succesfully:
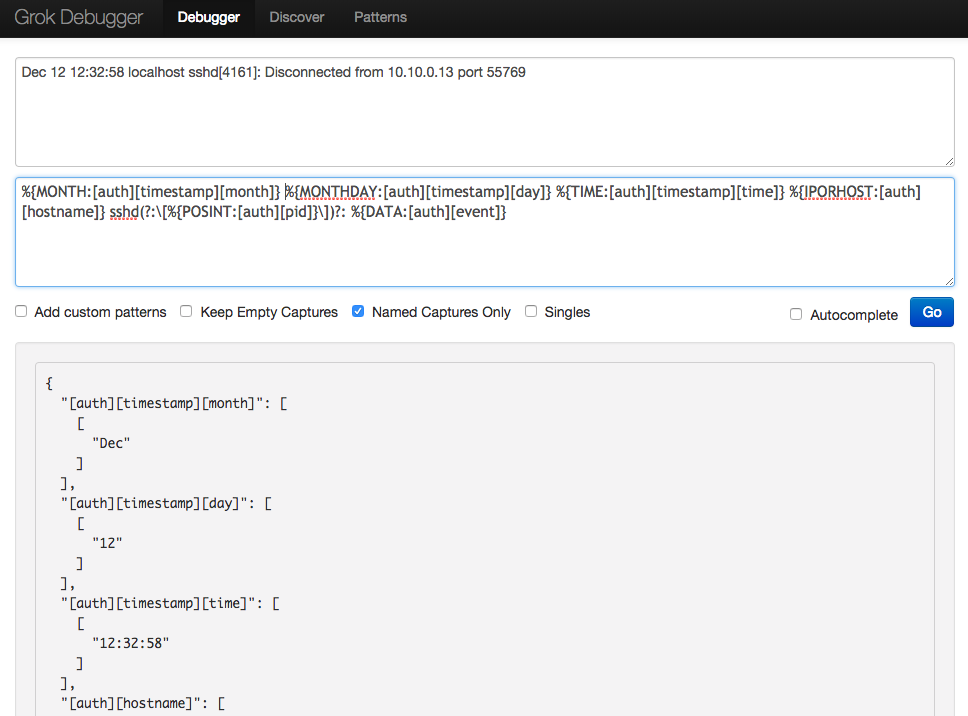
Note that we have different notation for identifiers here. What this means effectively is that we’ve grouped all parsed data into a top-level identifier: auth. The rules are simple: place identifiers in a square brackets and bear in mind that each new bracket represents a new, deeper level structure for the top-level identifier, just like a tree data structure. Here, the top level identifier auth has four second level identifiers: timestamp, hostname, pid and event. Of that four, timestamp has another level down etc.
Sometimes it’s easier for the long run to logically organise identifiers. If you want to know more, Elastic team wrote patterns for auth.log and covered an example for using it here.
Parsing the Nginx access log with GROK
Head back to our original Nginx log.
Let’s suppose we wish to capture all of the available fields from our log line. Using the information we know about nginx combined log format, grok patterns and online grok debugger, we can start typing our grok pattern.
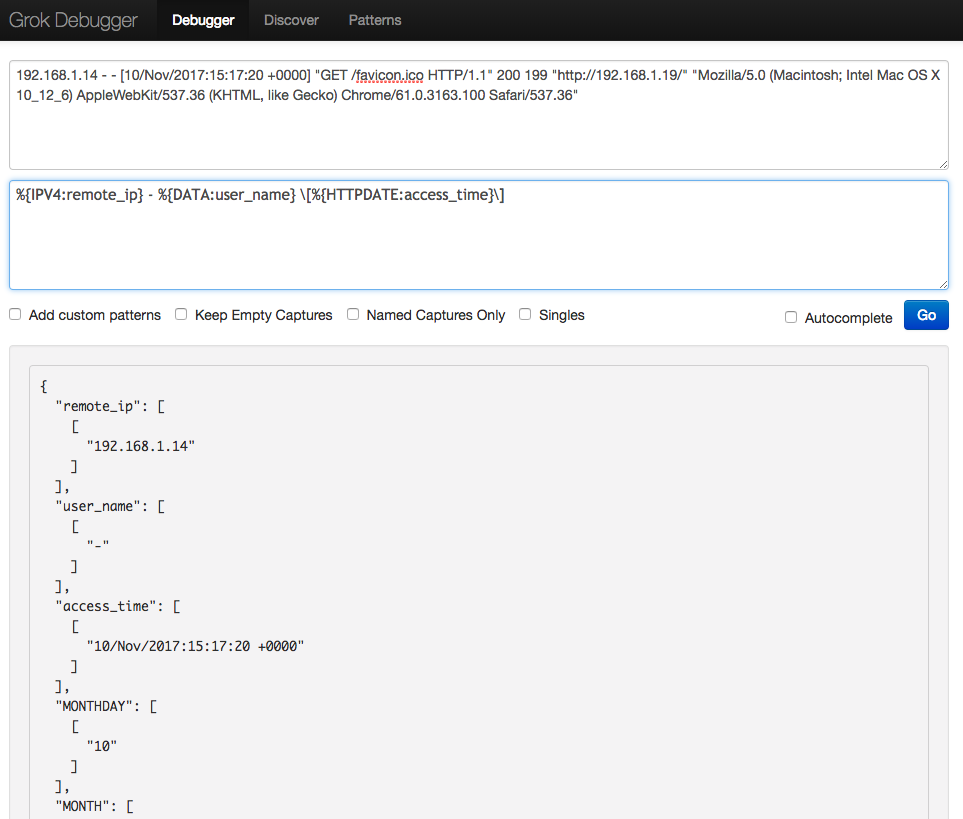
Eventually, we arrive to our complete grok pattern:
%{IPORHOST:remote_ip} - %{DATA:user_name} \[%{HTTPDATE:access_time}\] \"%{WORD:http_method} %{DATA:url} HTTP/%{NUMBER:http_version}\" %{NUMBER:response_code} %{NUMBER:body_sent_bytes} \"%{DATA:referrer}\" \"%{DATA:agent}\"
Now that we have written the grok pattern, we can start configuring the building blocks of this exercise: Filebeat and Logstash.
The Setup
Configure Filebeat
This is a fairly easy bit. Here’s what the configuration would look like for one Nginx access log. We will only change the prospectors and output section, while leaving the rest at default settings. For input_type we chose log and specified a path to the Nginx access log. To keep things as simple as possible, this concludes the prospectors section.
#=========================== Filebeat prospectors =============================
filebeat.prospectors:
- input_type: log
  paths:
    - /var/log/nginx/access.log
Next, the output configuration. Filebeat ships logs directly to Elasticsearch by default, so we need to comment out everything under the Elasticsearch output section:
#================================ Outputs =====================================

# Configure what outputs to use when sending the data collected by the beat.
# Multiple outputs may be used.

#-------------------------- Elasticsearch output ------------------------------
#output.elasticsearch:
#  Array of hosts to connect to.
#  hosts: ["localhost:9200"]

  # Optional protocol and basic auth credentials.
  #protocol: "https"
  #username: "elastic"
  #password: "changeme"
We enable Logstash output configuration, which resides directly under the Elasticsearch output section. You’ll need the IP address of the server Logstash is running on (leave localhost if it’s running on the same server as Filebeat). For sake of simplicity, in this demonstration we’ll run Logstash on the same server as Filebeat (and Nginx), but in production it’s advisable to run Logstash on separate machine (which comes handy when you start considering scaling up).
Back to our one little machine. Uncomment the output.logstash line and hosts line:
#----------------------------- Logstash output --------------------------------
output.logstash:
  # The Logstash hosts
  hosts: ["localhost:5044"]
That’s it for Filebeat. Restart the Filebeat service and check the output.
Restarting Filebeat sends log files to Logstash or directly to Elasticsearch. filebeat
2017/11/10 14:09:48.038578 beat.go:297: INFO Home path: [/usr/share/filebeat] Config path: [/etc/filebeat] Data path: [/var/lib/filebeat] Logs path: [/var/log/filebeat]
2017/11/10 14:09:48.040233 beat.go:192: INFO Setup Beat: filebeat; Version: 5.6.4
2017/11/10 14:09:48.040750 logstash.go:91: INFO Max Retries set to: 3
2017/11/10 14:09:48.041154 outputs.go:108: INFO Activated logstash as output plugin.
2017/11/10 14:09:48.041476 publish.go:300: INFO Publisher name: vagrant-ubuntu-trusty-64
2017/11/10 14:09:48.041789 async.go:63: INFO Flush Interval set to: 1s
2017/11/10 14:09:48.042824 async.go:64: INFO Max Bulk Size set to: 2048
Config OK
   ...done.
See? Told you it’s an easy bit. If you get the output like this, you’re good for the next step, which is…
Configure Logstash
As it has been said in the beginning, we’ll continue with this (rather lengthy) step in the next post. There we’ll configure and test Logstash, point out some tricky aspects while doing so, show how to enrich our data, and finally see what have we gotten out of this pipeline.
Continuation coming soon!

