Are you monitoring your database performance? If you aren’t - you should; if you are - how about monitoring autovacuum settings and performance as well?
We’re of course referring to PostgreSQL (PSQL in short). It comes in handy when working with many databases with each counting hundreds of tables, and they’re all configured with default settings. The version of PSQL we’ve worked on while writing this post is 9.6.
If you’re already doing this in some way, good! Here I’ll show how we’ve set up monitoring of PSQL autovacuum daemon and autovacuum parameters on Grafana, with Prometheus for time-series database for a client of ours.
To re-iterate the theory, PostgreSQL uses Multi-Version Concurrency Control (MVCC) to make each SQL statement see a snapshot of the database data as it was some time ago (this is a version). The space penalty of MVCC is named bloat. A simple example that illustrates table bloating is a repeated UPDATE operation on one row (as UPDATE is DELETE+INSERT). Bloated tables are taking unnecessary space and are slowing down queries. So, to keep things tidy, PSQL uses (auto)vacuuming as a hygiene for keeping table space optimal, by removing dead rows.
Let us take into account that default settings are suitable when your tables take a few hundred megabytes of space. But what if you own a production database that has gone into gigabyte size spectrum?
prod_database=> select pg_size_pretty(pg_database_size('prod_database'));
 pg_size_pretty
----------------
 156 GB
(1 row)
This database at one of our clients was experiencing several slow queries weekly that had slowed down site performance and shut down, which results with concerned questions and incident reports from end users and escalation within the company itself. Couple of more production databases (completely isolated instances) had shown this kind of erratic behavior as well.
Troubleshooting the issue yielded scarce information about possible root cause and catching locks and slow queries being run, we decided (among other things) to perform autovacuum analysis on all databases and their tables.
There are several articles on the Internet with regards to configuring autovacuum parameters for PostgreSQL, but here I’m going to focus on visualising data. We’re already using Prometheus with Grafana for monitoring at this client’s, and this PostgreSQL exporter was already running for our PostgreSQL monitoring, which shortened the time to setup extended dashboard significantly.
First I drew some configuration data from the database itself. Current autovacuum settings were as shown here:
prod_database=> select name, setting from pg_settings where category = 'Autovacuum';
                name                 |  setting
-------------------------------------+-----------
 autovacuum                          | on
 autovacuum_analyze_scale_factor     | 0.05
 autovacuum_analyze_threshold        | 100
 autovacuum_freeze_max_age           | 200000000
 autovacuum_max_workers              | 4
 autovacuum_multixact_freeze_max_age | 400000000
 autovacuum_naptime                  | 30
 autovacuum_vacuum_cost_delay        | 20
 autovacuum_vacuum_cost_limit        | -1
 autovacuum_vacuum_scale_factor      | 0.2
 autovacuum_vacuum_threshold         | 200
(11 rows)
I picked out a random table
prod_database=> select pg_size_pretty( pg_total_relation_size('blends') );
-[ RECORD 1 ]--+------
pg_size_pretty | 33 MB
and checked autovacuum properties for that table:
prod_database=> select schemaname,relname,last_vacuum,last_autovacuum,last_analyze,last_autoanalyze,vacuum_count,autovacuum_count,analyze_count,autoanalyze_count from pg_stat_user_tables where relname='blends';
-[ RECORD 1 ]-----+-------
schemaname        | public
relname           | blends
last_vacuum       |
last_autovacuum   |
last_analyze      |
last_autoanalyze  |
vacuum_count      | 0
autovacuum_count  | 0
analyze_count     | 0
autoanalyze_count | 0
Several other tables had shown same results, which means that most likely, the global autovacuum settings are enforced across all tables in the database. Moving on.
Formula for autovacuum treshold is this:
vacuum threshold = autovacuum_vacuum_threshold + autovacuum_vacuum_scale_factor * number of (live) tuples
For example, if we have 13800 live tuples (concretely, rows) and 4500 dead tuples, with autovacuum_vacuum_threshold = 200 tuples and scale factor of 0.2, we get autovacuum execution at 200 + 13800 * 0.2 = 2960 dead rows.
So, how do we see this?
Head over to Grafana. I’ve already set template variables to select each production environment’s database, so it merely needed finer tuning through means od accessing separate tables and visualising the mentioned autovacuum formula on them.
First, off to templating variables. First, we want to be able to select databases that start with test or prod name (variable db)(1). Then we use a mapper plugin with which we have mapped corresponding database instance to a human understandable name in order to identify Master and Slave instances (2); this was done with Grafana SimpleJson Value Mapper. For selected database, we select master node (3) and from that node and database we wish to choose a table (4).

Now that we’ve set that up, the tedious part awaits - show all autovacuum parameters on database level. This can be done by simply calling corresponding labels of Prometheus PSQL exporter, i.e.: pg_settings_autovacuum_analyze_threshold{instance="$masterdb"} for autovacuum_analyze_threshold parameter.
When arranged, here’s what these parameters are showing:

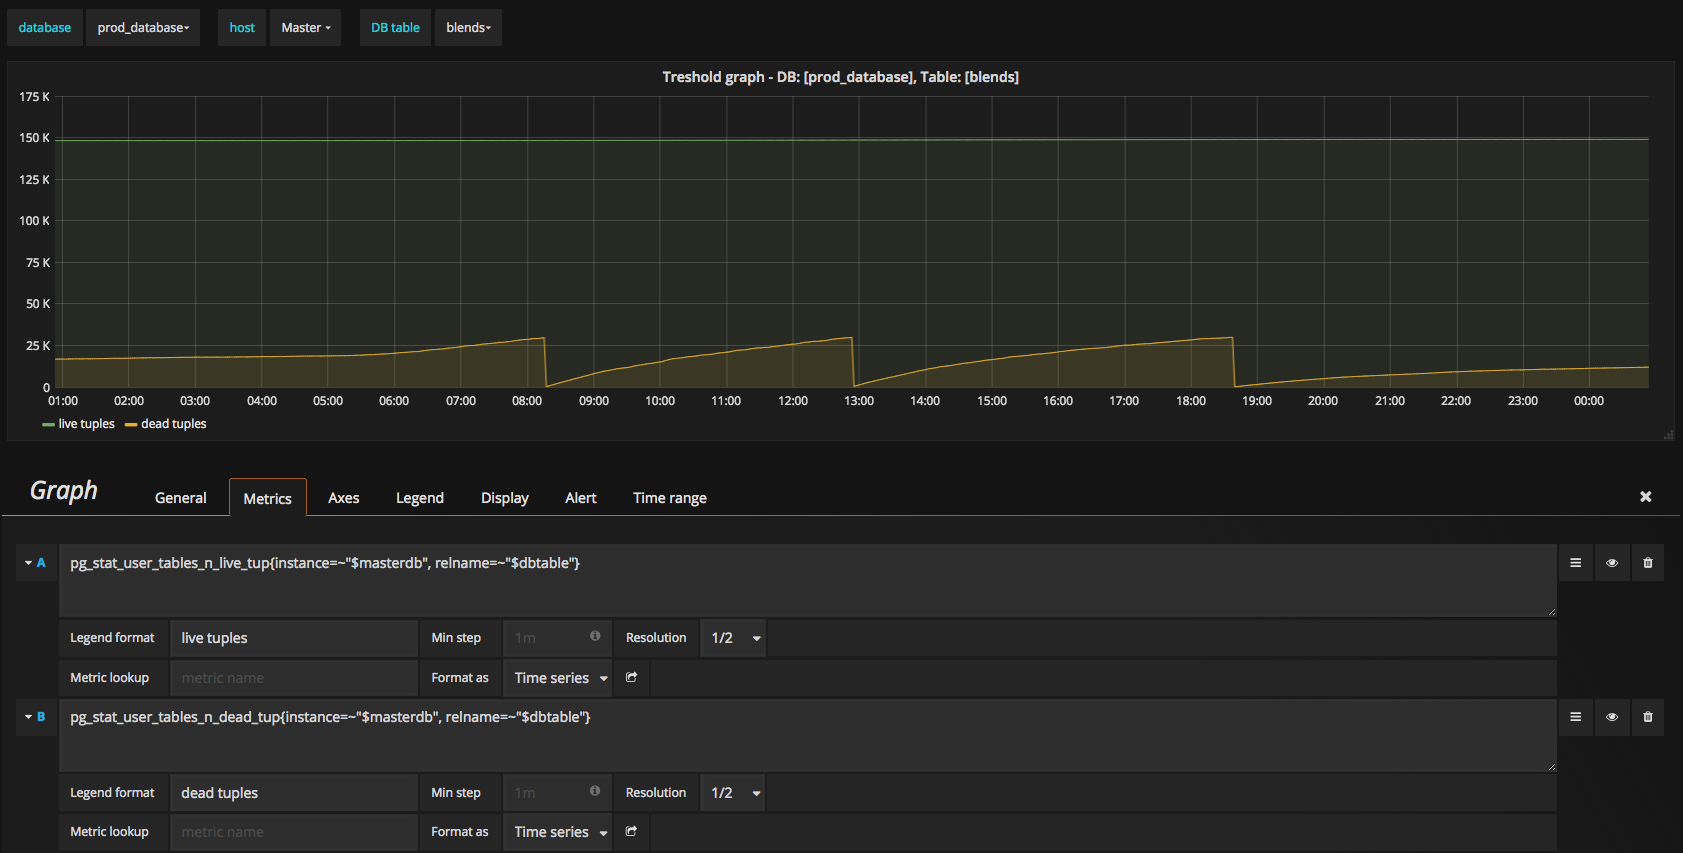
The second easy part is creating a graph with just live and dead tuples.

Next, we translate the autovacuum formula to a Prometheus Query:
pg_settings_autovacuum_vacuum_threshold + pg_settings_autovacuum_vacuum_scale_factor{instance=~"$masterdb"} * pg_stat_user_tables_n_live_tup{instance=~"$masterdb", relname=~"$dbtable"}
But we get no result. Why? Have a look here:

And here:

It’s clear that pg_stat_user_tables_n_live_tup has two more metric names available so when running mathematical operations, things do not mesh well. For everything to mesh well though, we need to ignore metrics that are not relevant for the calculation. These metrics are relname and schemaname and here’s how you ignore them:

With this query we get the value of 30089.4 for autovacuum treshold. So, the full command for autovacuum_vacuum_threshold ready to be transported to Grafana is this:
pg_settings_autovacuum_vacuum_threshold + pg_settings_autovacuum_vacuum_scale_factor{instance=~"$masterdb"} * ignoring(relname, schemaname) pg_stat_user_tables_n_live_tup{instance=~"$masterdb", relname=~"$dbtable"}
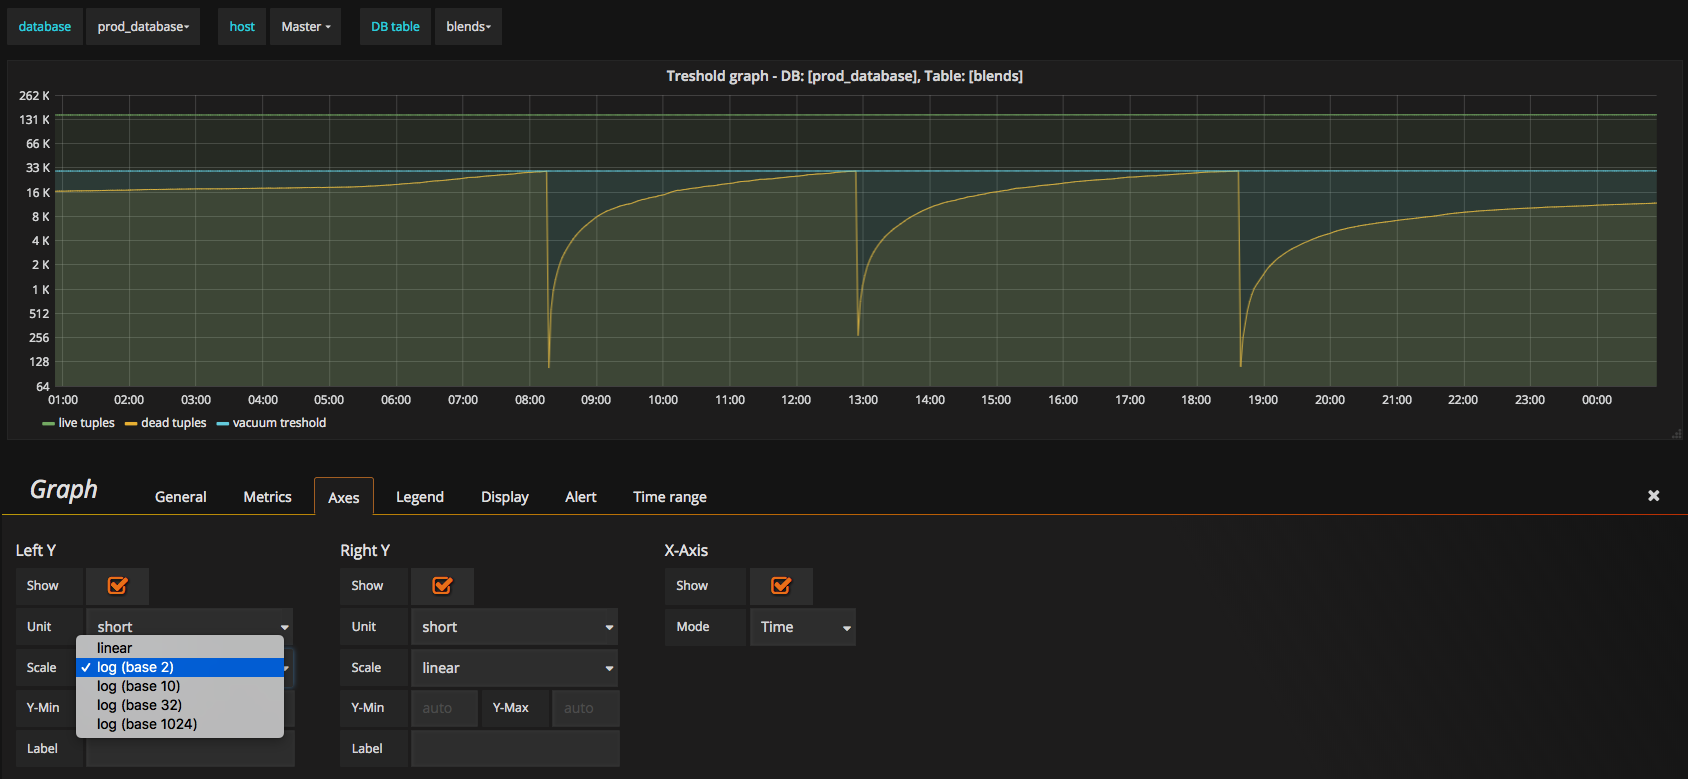
And in Grafana, data comes to graphs beautifully. When we graphed only live and dead tuples, there was lots of space between two graph lines. This was due to scale of the graph being set to linear. In this case, graph looks better when plotted on logarithmic scale.

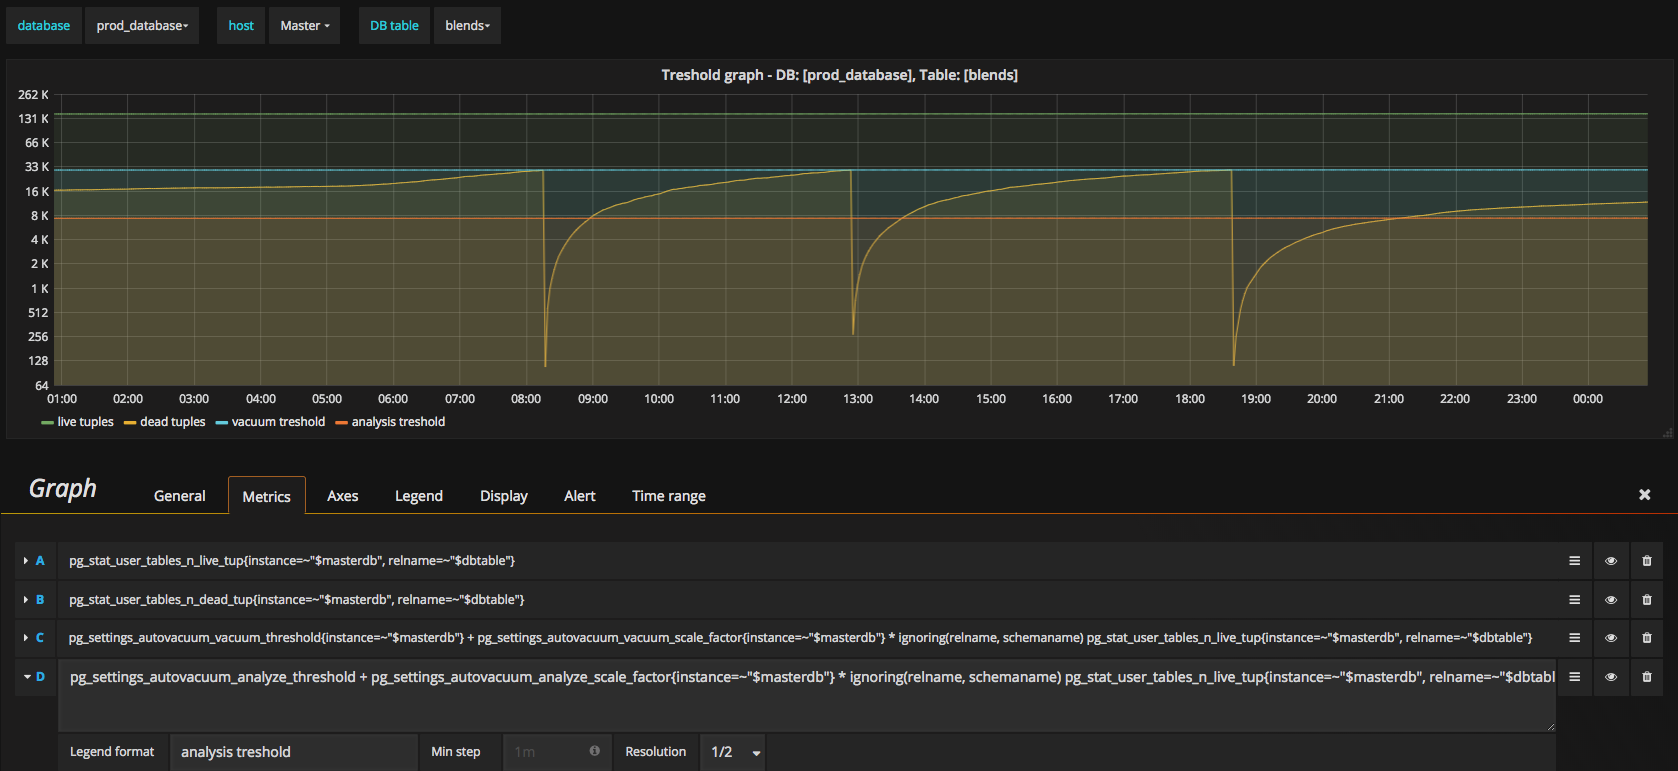
We can now see from the graph that autovacuum process is triggered when number of dead tuples touch autovacuum treshold, which is about 30k dead tuples (30089 to be exact). Similarly, we can add analysis treshold graph as well:

There is of course room for improvement (for example to write out autovacuum setting per selected table), but this proves as a neaty graphical base for further PSQL tables analysis. Using this, DBA can tweak autovacuum parameters per table, check the performance of the database and reiterate and we have another level of transparency in database performance monitoring.

