Why even bother with logs?
Humans have a natural need to track progress. It keeps our target clear, focus tight, and helps us monitor and diagnose issues when they show up. If you pick a field – any that comes to mind, from bees collecting pollen to space program design – logging data has an application for each one of these.
Let’s pick one example for this, say health. When a doctor is diagnosing a patient, he’s checking the patient’s medical history, which we can essentially think of as a collection of logs. The doctor also performs various checks and observations of the patient, which can be seen as new data. Once gathered and interpreted, data tells a historical tale of the patient’s condition.
If we shift to IT with this an analogy in mind, then the system administrator is a doctor and the servers are his patients. Sysadmins observe, supervise and monitor server behaviour. So if an application on a certain server is not working properly, they can check the system and application logs on this server – just like a doctor diagnosing a patient. Therefore, log tracking and aggregation hygiene is very much advised in the IT world.
Oh, did I tell you this was just one use case for IT? There are more. There are virtually endless applications to what kind of data can be tracked and aggregated. The limit and resolution of the processed data can be fine-tuned to preference.
Still, how do I log and monitor data for all of my 63975 servers at once?
First of all, strive not to lose a single log entry that you intend to monitor; this will ensure excellent service record. Next, you need to collect and aggregate the logs, ingest and process them in order to display an organized and cleaner dataset. Fortunately, there are several software solutions that take care of this dirty work. Most of them are Open Source, which is just what we want.
But server or application logs themselves are dull, rigid and utterly boring for humans to read. It would be great if we could be able to show this collected log data as graphs or tables. Other than looking very cool, visualising the data may help you find issues quicker. It’s easier to notice a sharp spike in a graph than it is to notice gradual increase of some parameter while scrolling through a log file.
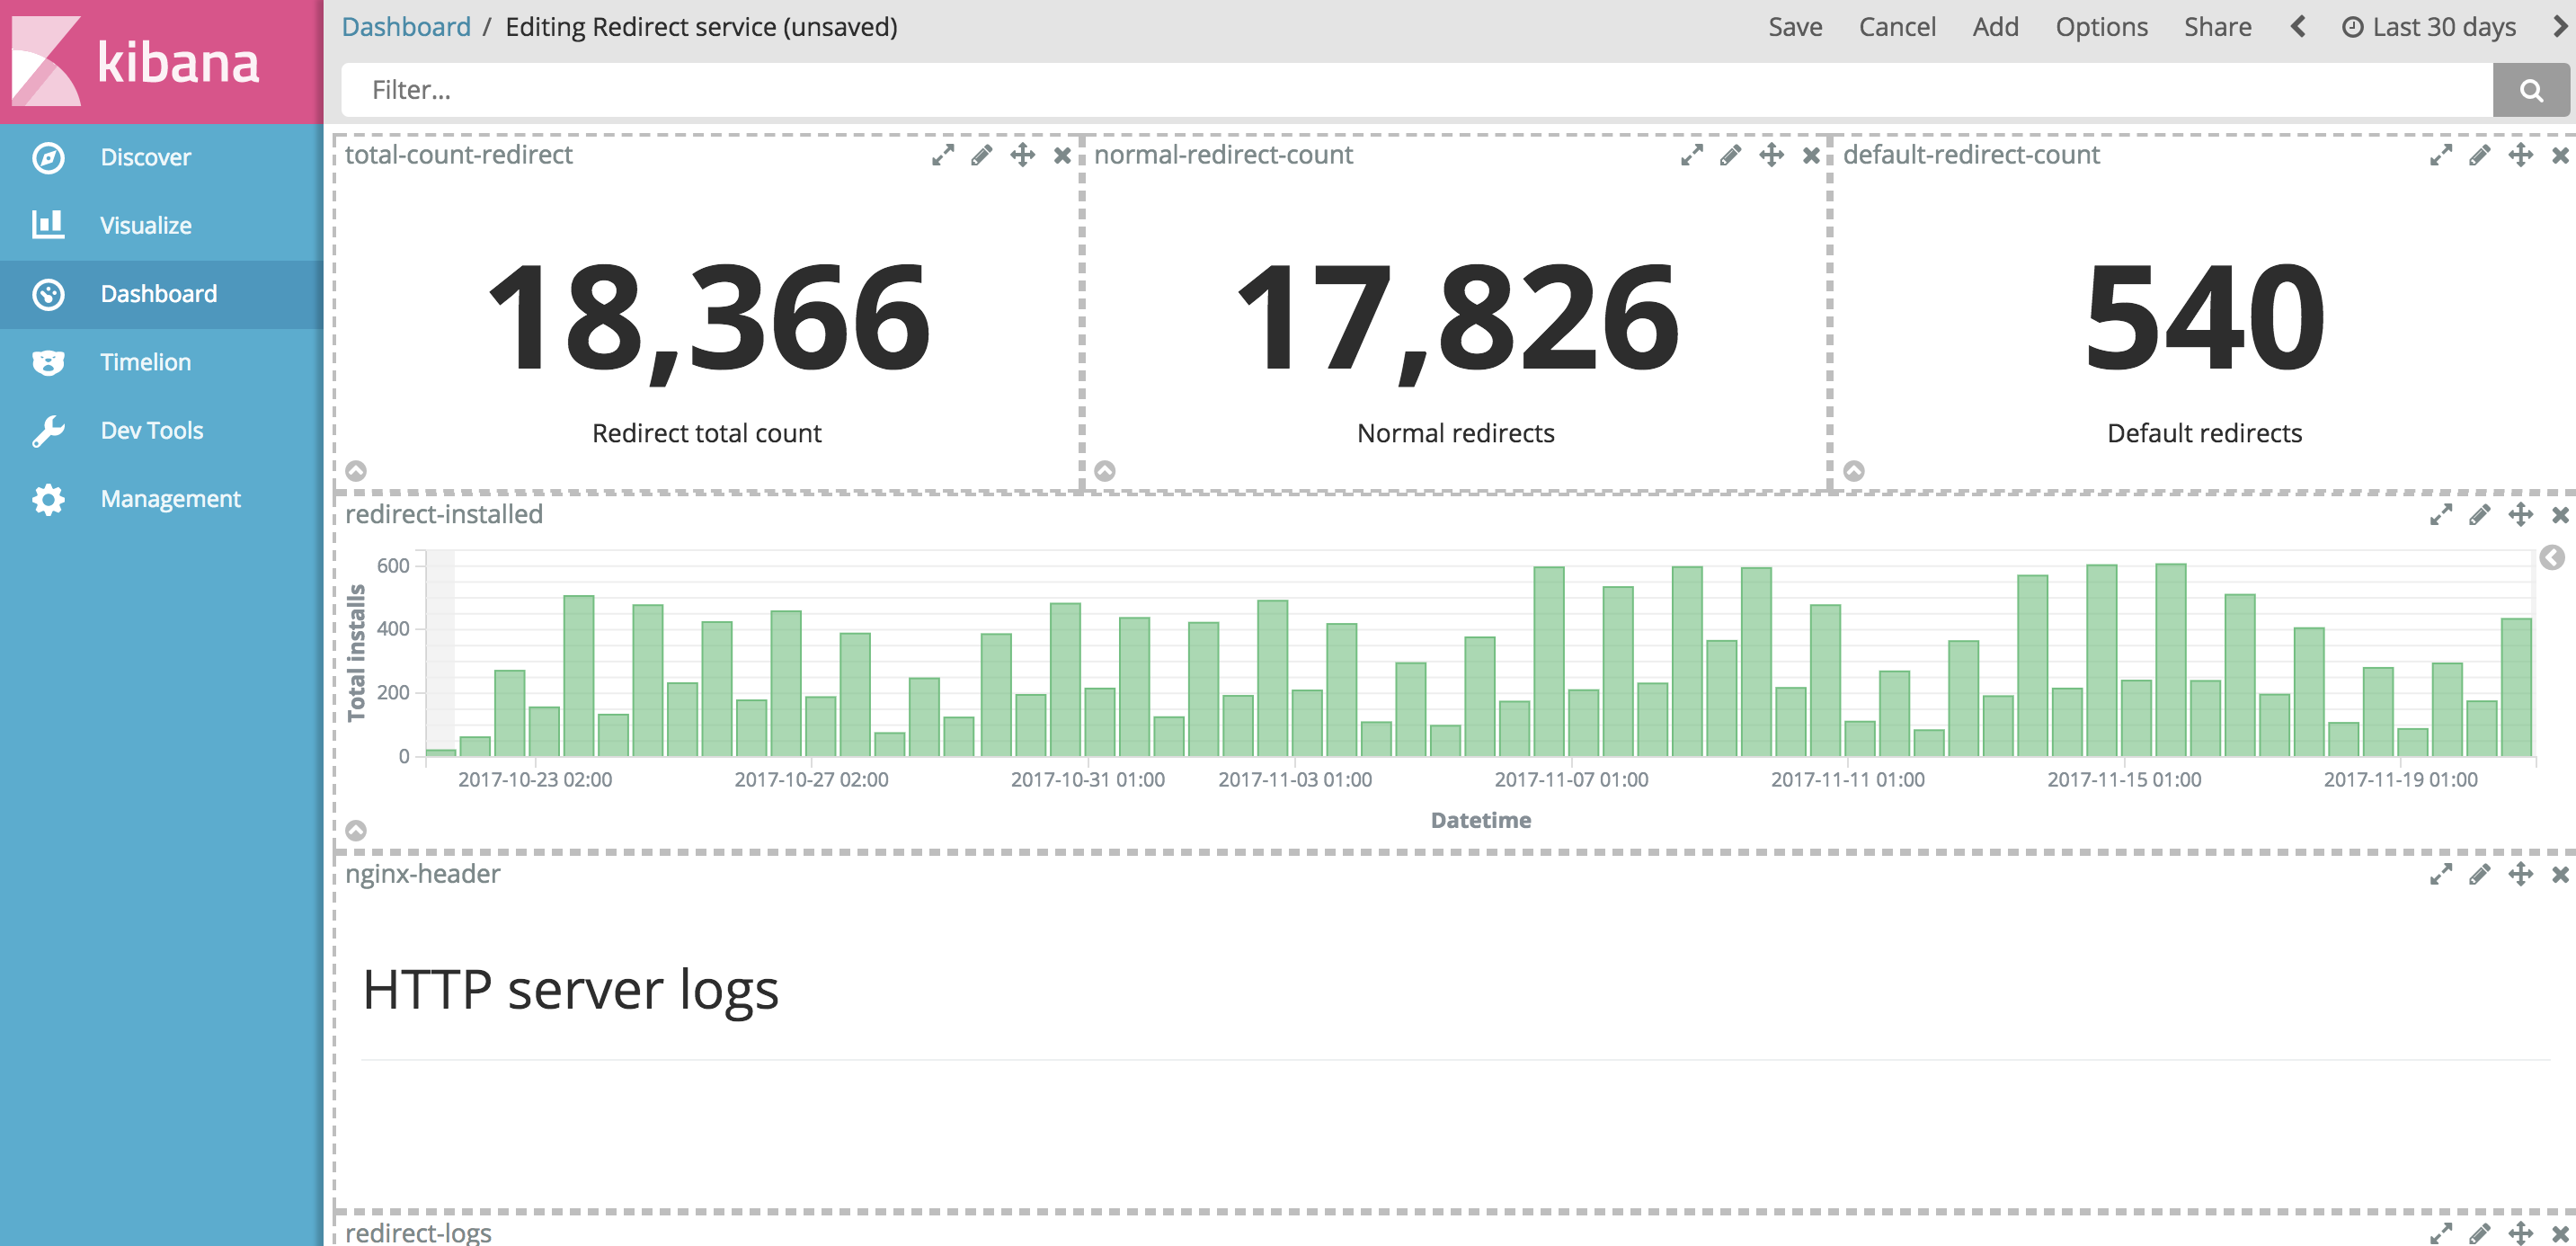
Source: Internal Kraken Kibana dashboard
Let’s quickly check what’s currently available on the market. Here we’ll dive more into technical stuff, so hold on!
What’s currently available
We’re currently living in a digital era where we have an abundance of logging software and abundance of choices. Here we’ll quickly cover just a few of these that caught our attention.
Splunk
Splunk is proprietary software that tries to be a one-for-all data collection and analysis tool. It has predefined rules for processing of various log types, you feed it data and you search and access it through Splunk Search Processing Language (SPL), which you first need to learn how to use.
EFK (Elastic, FluentD, Kibana)
EFK is an open source stack as well as ELK (more about ELK below). Elasticsearch is a NoSQL database which uses Lucene engine to search for data, Kibana is data visualisation tool that works on top of Elastic and is used to create dashboards, visualise and organize the displayed data. The only difference among the two stacks is the log processor and log transporter/shipper they use. The log processor ingests the data, processes it by slicing, matching and filtering, and finally ships the results where you tell it (a streaming DB, for example).
FluentD and Logstash share many similarities, but some notable differences are: FluentD has integrated reliability and failure recovery and requires usually less running memory. But FluentD uses tags to route events, making the nature of configuration to be declarative. You write what you want to catch and let the system figure it out how. Plugins for FluentD are mostly developed by its community.
ELK (Elastic, Logstash, Kibana)
All three of the components are developed under the same project, and the plugin base is centralized as well. Logstash can be more Memory thirsty, since it requires Java. To ensure realiability, Logstash is best to be deployed with Redis. But with Logstash, the data comes in a single stream, where it passes through a series of conditionals that tell what to do with parts of a log, what to take and discard and how to process the data it slices. This makes it have more of a procedural approach.
Our choice – ELK
Well, Splunk is proprietary, so that resolved itself quickly. We don’t prefer proprietary software, we value community and freedom. What we do prefer is to be able to know, see and influence how things work. Therefore we choose the ELK stack. It just seems more reasonable to use the stack that comes from one project and has a good support.
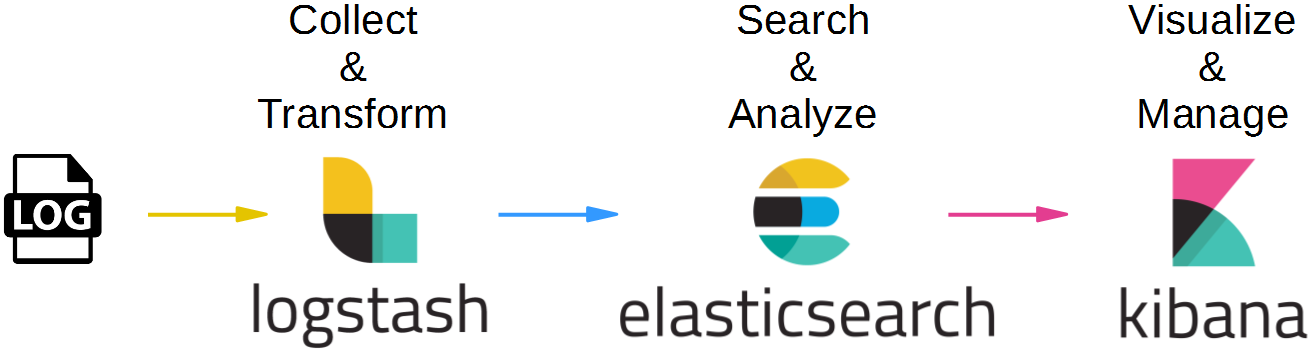
Source: [Oliver Veits blog]
Configuration versatility as a leverage
ELK stack comes with a powerful freedom to configure each part of the stack. This enables us to hand-pick and filter the targeted data, meaning we can custom-tailor the final solution to client’s needs. We do not believe there is or should be a one-fits-all solution, and our experience has shown this approach works best.
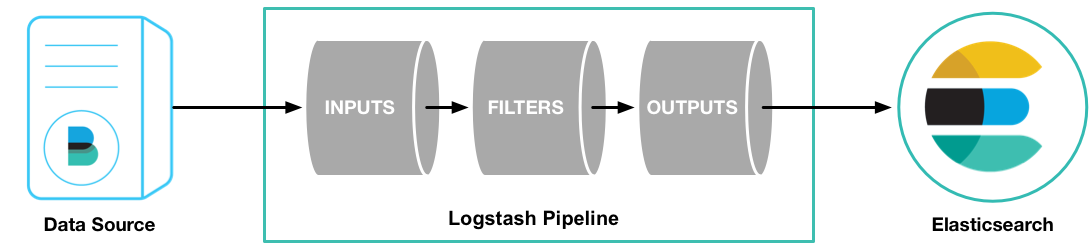
Source: [Logstash pipeline]
Although Logstash has Achilles heel in terms of message queues, it’s still less painful to solve that issue by spinning up a Redis instance alongside Logstash for improved reliability than it is to configure complex built-in reliability that FluentD provides natively.
So no matter what type your logs are, we have the freedom to define how the logs will be processed based on our customer needs, process them and feed them to Elasticsearch. Just how we like it. Centralized plugins database also seems a more sensible choice than a dozen official plugin releases out of over 500 seen on FluentD.
In the next blog post, we’ll get a bit more technical and show how do we send (ship) logs to Logstash and parse log lines for Nginx access log.